Asynchronous JavaScript + XML (Ajax) continues to raise user expectations for interactivity and performance, and developers are increasingly treating Ajax as a must-have component of their Web applications. As more code is moved client side and the network model changes, the community is responding by building more tools to address the unique performance challenges of Ajax. Examine toolsets that find and correct performance problems within your Ajax-
enriched applications.
Performance is one of the primary motivations for enhancing applications with Ajax. Ajax can improve response time by communicating with the server without full-page requests. By reducing response time, Ajax can provide a significantly better user experience. However, analyzing and improving the performance of Ajax applications requires a different toolset than traditional Web applications. This article examines these tools and shows how to use them to find performance problems and make corrections.
An Ajax application’s performance is based on several aspects of a Web application:
* Server response time
* Network transfer time
* Client JavaScript processing time
In traditional Web application development, server response time is the primary focus for performance analysis. Most performance analysis measures the application server’s ability to quickly handle requests, carry out necessary application logic, and generate a response. In Ajax application development, this is still a critical aspect of the application’s performance but is generally well understood.
The tools
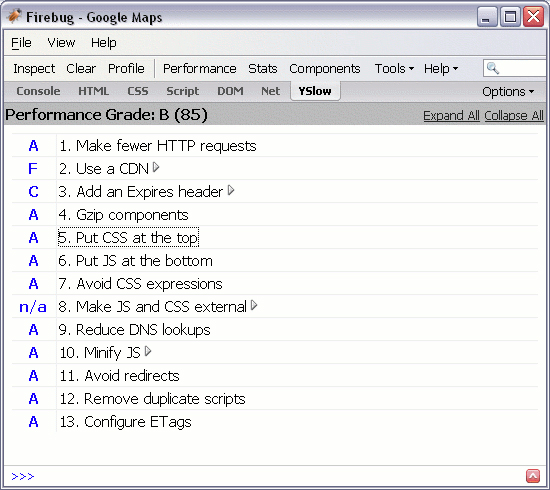
To understand what aspects of a Web application you need to improve, you must properly analyze the components of the application. This article looks at how you can use the Firebug extension to Firefox and the YSlow add-on to instrument a Web application. After you install these tools, connect to the site that you are developing and click YSlow on the Firefox status bar. This opens the YSlow interface in Firebug. Now click the Performance button. YSlow performs an analysis of your application and provides a report on the different parts of the network transfer time of your application, as Figure 1 shows.
Network transfer time
In most Web applications, network transfer time is the biggest bottleneck. With a YSlow report, you can analyze the different aspects of the network transfer to understand what can be done to decrease the transfer time.
Reducing HTTP requests
Every HTTP request requires some time for the request to be sent to the server and the response to be retrieved. Even when responses are small, there is still the baseline roundtrip time, which is referred to as latency. YSlow provides a grade based on how many HTTP requests are made. A large number of requests results in significantly slower load times. You can reduce HTTP requests by simplifying the page so that fewer components need to be loaded. You can reduce image requests by using CSS sprites. Tools that generate CSS sprites are available (see the Resources section). To reduce script and CSS requests, include them inline in the page or combine multiple scripts or CSS files together.
You can reduce HTTP requests by providing HTTP cache expiration headers with future dates that allow browsers to cache components. It is important that as a user navigates from page to page, or returns to visit your site, that components can be cached and do not need to be downloaded each time your site is visited. Proxies can also cache frequently loaded content if proper expiration headers are provided. An expiration header looks like this:
Expires: Wed, 10 Mar 2009 10:00:00 GMT
Remember that if you use far future expiration dates, browsers will still cache your content even when you have changed it. You may want to reduce the expiration to a day in the future. You can also change filenames when you version them so that new URLs are requested when a new version is released, and the browser has to make a new request. You can configure Apache to add expiration headers with an ExpiresDefault directive:
ExpiresDefault "access plus 10 years"
With YSlow, you can also look at the total download size of your page by clicking the Stats button. YSlow shows the size of the page for a first-time visitor (with nothing cached) and for subsequent page visits (when caching can be used).
Alternate DNS lookup
HTTP requests can involve more than a just a roundtrip to your server. If there are multiple host or domain names used by resources, the browser may need to do additional Domain Name System (DNS) lookups. YSlow alerts you if multiple names must be looked up. However, it is important to note that multiple DNS names can actually be a performance benefit as well. Most browsers only allow two connections per host name. But with multiple host names, more connections — and consequently, more concurrent downloading — can take place.
Reducing the size of component transfers
In addition to reducing the number of HTTP requests, it is also advantageous to reduce the size of the components that are requested. Techniques can be applied to compress certain formats. YSlow indicates what techniques can be successfully applied to reduce response size.
You can shrink JavaScript code, CSS, and HTML by eliminating unnecessary whitespace and comments. You can further compress JavaScript code by renaming variables. Packer and YUI compressor are effective tools for JavaScript compression, and YUI compressor supports CSS compression as well. You can compare minifiers with The JavaScript CompressorRater.
One of the most effective ways to compress resources is by enabling gzip (short for GNU zip) for text-based resources. Using gzip, you can generally reduce content size by about 70%. Do not use gzip to compress resources that are already compressed, such as images and movies. Good candidates for gzip include CSS, HTML, JavaScript code, XML, and JavaScript Serialized Object Notation (JSON). Apache 1.3 supports gzip with mod_gzip and Apache 2.0 uses mod_deflate.
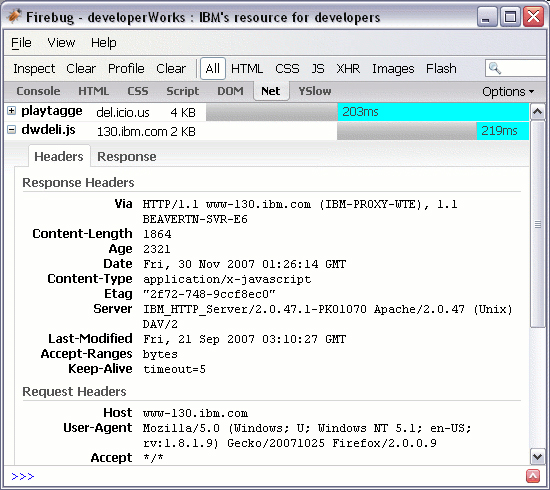
Not only is it important to minimize the size of HTTP responses in terms of resource size, but it is also important to minimize the size of HTTP requests. For many Internet users, upload speeds can be significantly slower than downloads, and so performance can be more sensitive to request size. Large URLs, large post data, and excessive headers can also increase the size of a request. In Firebug, you can go to the Net tab to view your requests, as Figure 2 shows. For each request, you can expand the request to see the request headers. One of the most common sources of unnecessarily large header sizes is large cookies. Cookies are included in the header on every request, and, therefore, large cookies add a lot of extra overhead.
Other network transfer performance improvements
Another YSlow recommendation is to use a content delivery network (CDN). A CDN provides a distributed network of servers with content that is closer to your end users for faster response times.
You can also improve the speed of rendering your Web pages by properly ordering your CSS and scripts. YSlow analyzes the position of your CSS and script declarations to provide information on how to improve the ordering. It is recommended that CSS declarations be at the top of the page so the CSS can immediately be used for rendering, and the scripts be at the bottom of the page so the page can render before loading the JavaScript code for interaction.
JavaScript processing time
After your Web page is successfully generated by the server and transferred to the browser, Ajax applications generally rely on JavaScript code for interactivity with the user. Most users are prepared to wait a little while for a page to fully download, but quality interaction depends on rapid feedback, so quick response to various components on your page can be the most important aspect of an enjoyable user experience. Also, browsers are usually still responsive when waiting for resources to download, but if JavaScript code is executing continuously, it can completely lock up the browser.
Firebug comes with a profiling tool. To use the profiler, go to the Console tab and click Profile to start the profiler. It may help to understand what part of your Web application makes heavy use of JavaScript code. The profiler also yields more accurate results if you can repeat the activity you are testing several times. For example, if there is a significant amount of JavaScript code that is executed when the page loads, you may want to do several page loads. If there are JavaScript hover event handlers, you may want to move the mouse around the page for a while to let the profiler collect a decent amount of information. When you finish your activity, you can click the Profile button again to display the profile results, as Figure 3 shows.
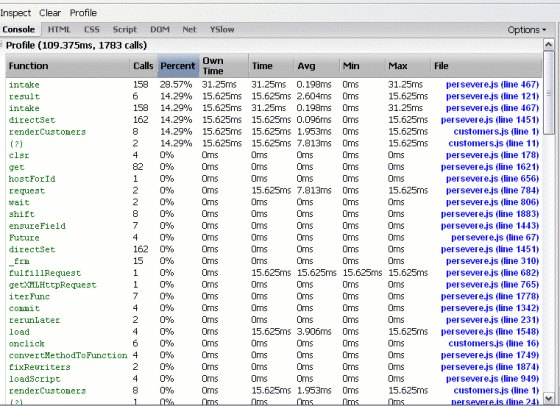
The profile result lists all the function calls that took place during the profile. Each entry shows the number of times that the function was called and statistics on the processing time for the function call. There is a Time column that indicates the total amount of time spent waiting for the function to return, and there is an Own Time column that indicates the total amount of time spent waiting for the function to return minus the time the function spent waiting for calls it made to return. Own time is generally the most important time because it represents where the majority of the expensive processing is taking place, and this time is what the values in the Percent column are based on. By default, Firebug sorts on the Percent column, with the highest values at the top. This is a convenient way to read the profile because the most expensive calls are on top, and you can focus your efforts on improving the performance of these functions. With Firebug, it is easy to go to the function source; you can simply click on the entry in the list to go to the function.
When evaluating the performance of your JavaScript functions, it is also important to note the number of times the function was called. If it is called a large number of times, the function itself may not necessarily be slow (you can see the average processing time for the function), but it may simply be called too frequently. Sometimes poor performance can be a result of a function being used more frequently than expected. Hover event handlers such as onmousemove often produce a large number of events.
If you can determine that a certain function is taking an excessive amount of time in processing, you may want to look at your JavaScript code for possible problems.
Table 1. Slow JavaScript operations
| Operation | Description |
|---|---|
| DOM access | Interaction with the DOM is usually slower than normal JavaScript code. Interaction with the DOM is usually inevitable, but try to minimize it. For instance, dynamically creating HTML with strings and setting the innerHTML is usually faster than creating HTML with DOM methods. |
| eval | Whenever possible, avoid the eval method because significant overhead is involved in script evaluation. |
| with | Using with statements creates additional scope objects that slow variable access and create ambiguities. |
| for-in loops | Traverse arrays use the traditional for (var i=0; i<array.length;i++) instead of for-in loops. Unfortunately, most JavaScript environments have a slow implementation of for-in loops. |
Firefox with Firebug and YSlow is certainly the best choice for profiling. For Safari on Mac OS X, you can also use Web Inspector to analyze HTTP requests. For JavaScript performance profiling, you can use manual techniques to gauge the performance of certain functions. To instrument a function manually, you can measure the execution time with the Date function, as Listing 1 shows:
Listing 1. Manual method timing
function myFunctionToTest() {
var start = new Date().getTime();
… // body of the function
var totalTime = new Date().getTime() – start;
}
One particular problem that can plague performance is the poor memory management of Windows® Internet Explorer®. Unpatched Internet Explorer 6 and prior versions exhibit progressively slower behavior as more objects and properties are created. As a general rule, if you have more than 5000 objects, old versions of Internet Explorer will be considerably slower.
Conclusion
Using Firebug and YSlow, you can thoroughly analyze your Web applications to make educated changes to improve performance. YSlow provides detailed information to assist in reducing network transfer times. Firebug provides detailed JavaScript profiling analysis to determine critical areas of code to improve. Together, these tools can help you build Web applications with performance that provides the highest level of user experience.
